A Quick Introduction to the DynaMind GUI
To get started with DynaMind we describe how to build a water supply infrastructure model for an abstract city. We assume that you have been able to install DynaMind and know how to start its graphical user interface (dynamind-gui).
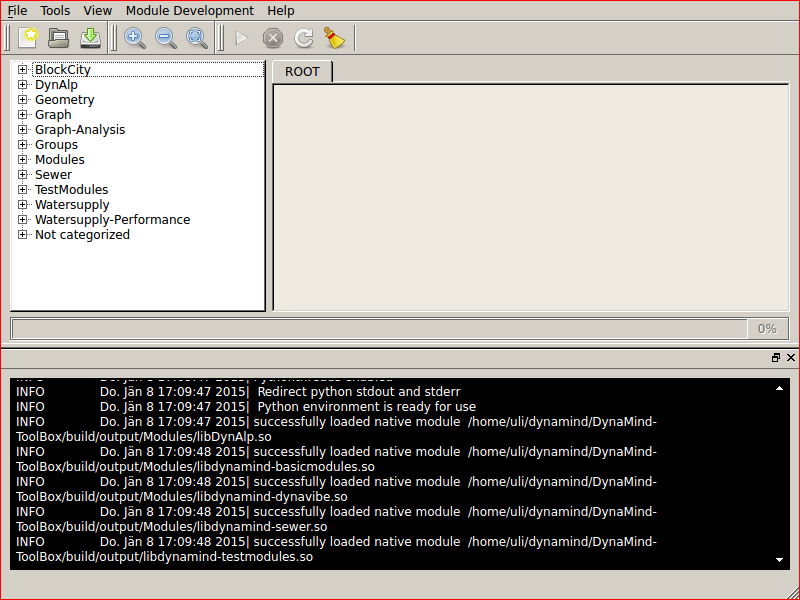
After start-up you are presented with a window that has three main parts. Your workflow window (that is currently empty) describes the workflow for the future model that we build. On the left you see a list of available modules separated into different categories that can be seen as building blocks for your model. Finally the lower part of the window shows log information that is mainly useful in case something went wrong.
The Problem
We will model our city as a superblock (i.e. a rectangle) that is further partitioned into smaller city blocks using a grid system. In addition we assume that every grid point has to be connected to the water supply system and want to find an efficient pipe structure to achieve this goal. One solution to this problem is to model the supply system as a connected graph where nodes represent junctions and edges represent streets with possible pipes. For the sake of convenience we consider a minimum spanning tree of this grid graph a sufficient solution to the problem. In the following we will explain step for step how to implement this solution in DynaMind.
Building a workflow
First we have to add our superblock. You can find the SuperBlock
module in the BlockCity category on the left and can add it to your
workflow window via a drag&drop operation. Let us now take a closer look
at the module. One important property of a module are the data
streams (also views) it operates on.
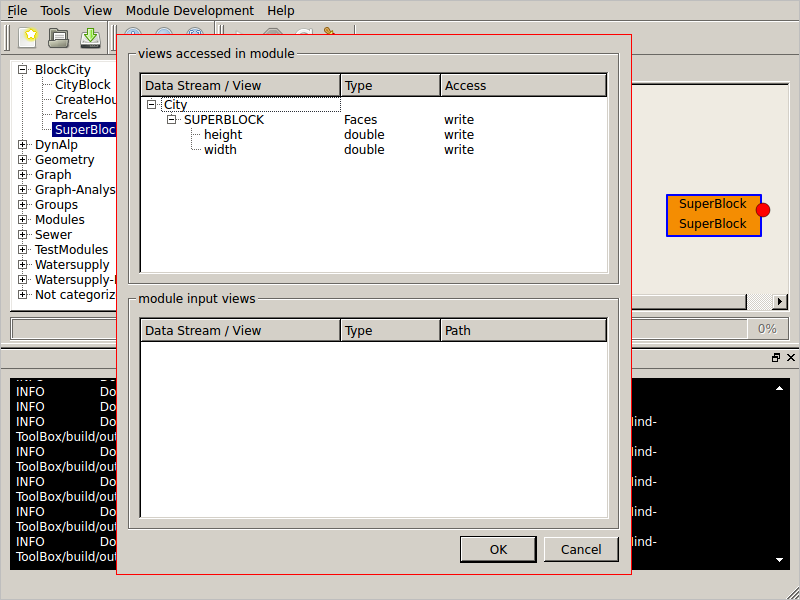
If you right-click the module and select show data stream you get
information about how the module accesses the different data streams
that you define (views accessed in module) and the data streams in
its scope (module input views). For our module the latter table is
currently empty as we did not define any data streams yet. However the
upper table is non empty and indicates that we write a data stream
named SUPERBLOCK of type Faces which has the attributes
height and width of type double, respectively.
The second property is the configuration of a module (accessible via a
double-click) that allows one to set module specific parameters. Set the
superblock’s height and width to 400 and 600, respectively and apply the
changes (press OK).
Next we want to partition our superblock into smaller city blocks.
Drag&Drop the CityBlock module into your main window. Furthermore take a look at its property section
and change its EdgeName parameter from “STREET” to “EDGES”.
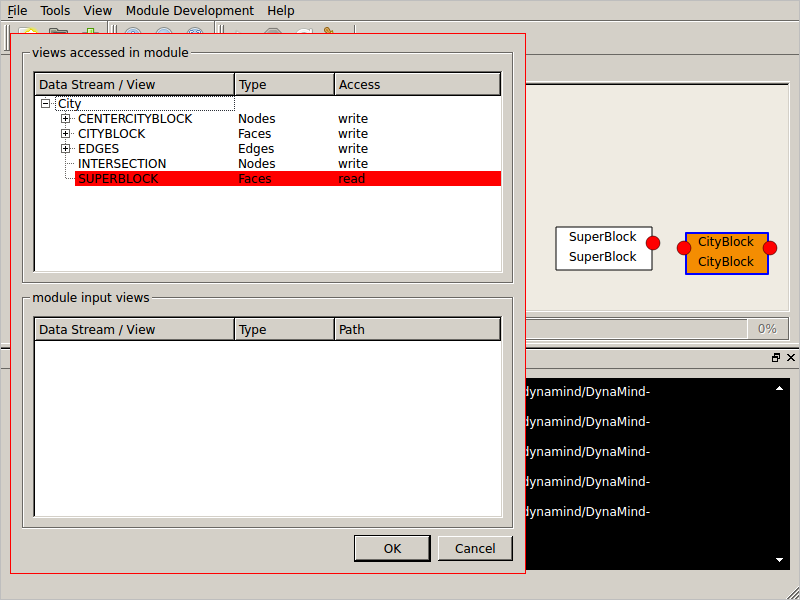
Again we take
a look at the module data stream section (right-click and select
show data stream). Note that the module input views table
is again empty and that the views accessed in module table’s
SUPERBLOCK row is marked red. This is caused by the reason that a
city block module needs to read a superblock but currently does not
have any in its scope.
We can solve this problem by connecting the superblock’s out port to
the city block’s in port (using drag&drop) to declare a
dependency between these modules. In particular this brings data streams
defined in preceding modules into the scope of succeeding modules. After
connecting the two modules convince yourself that the city block module
can now read the superblock by taking a look at its data streams. Note
that SUPERBLOCK is now available in the module’s input views section
(its scope).

Executing a Workflow
At this point it makes sense to visualize our city to check if it
suffices our expectations. First we have to execute our workflow by
clicking the Run Simulation button in the toolbar. As our model is
very basic the results are available immediately and can be inspected.
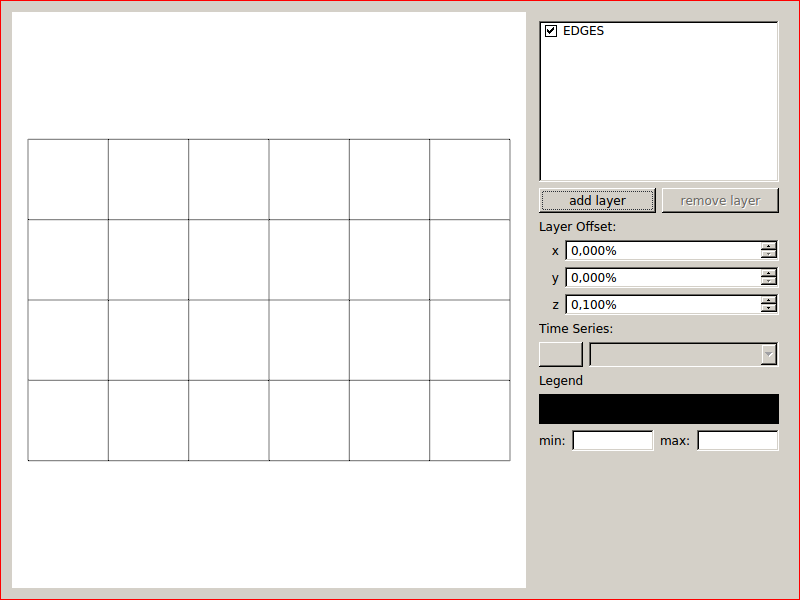
Right-click on the city block, select view data at out port 'city',
click add layer, select EDGES and press OK. You can see a
visual representation of our abstract city (a grid in our case).
Solution
As explained earlier we want to find an efficient pipe structure for our
abstract city’s water supply system by calculating a minimum spanning
tree. You can
find the SpanningTree module inside the Graph category on the
left. Add it to your workflow (drop it anywhere) and inspect its data
streams. The SpanningTree needs NODES and (weighted) EDGES
to calculate the tree (taking a look at a module’s data streams is a
good heuristics when specifying workflows with DynaMind). We already
defined EDGES previously via the city block module.
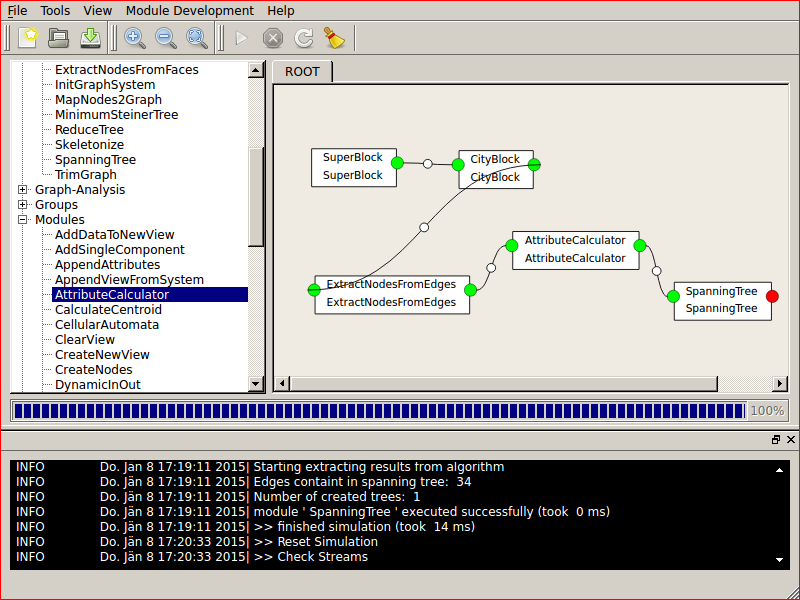
To satisfy the need for nodes we add the ExtractNodesFromEdges
module (in the Graph category) and connect its in port to the city
block module. The last thing we are still missing is the Weight
attribute that is essential to the minimum spanning tree calculation. We
provide it by adding a AttributeCalculator which is a module that
makes it possible to append attributes to defined data streams (category
Modules). In particular we first connect its in port to the
previously added ExtractNodesFromEdges and its out port to the
SpanningTree module. At this point remark the warning about the
non-existing attribute Weight in the log section of the window.
We get rid of it by accessing the module’s property section
(double-click) and selecting EDGES in its views section. We insert
“Weight” into the Attribute field (this is expected by the spanning tree
module) and insert an arbitrary constant (42 comes to mind) into the
Expression field.
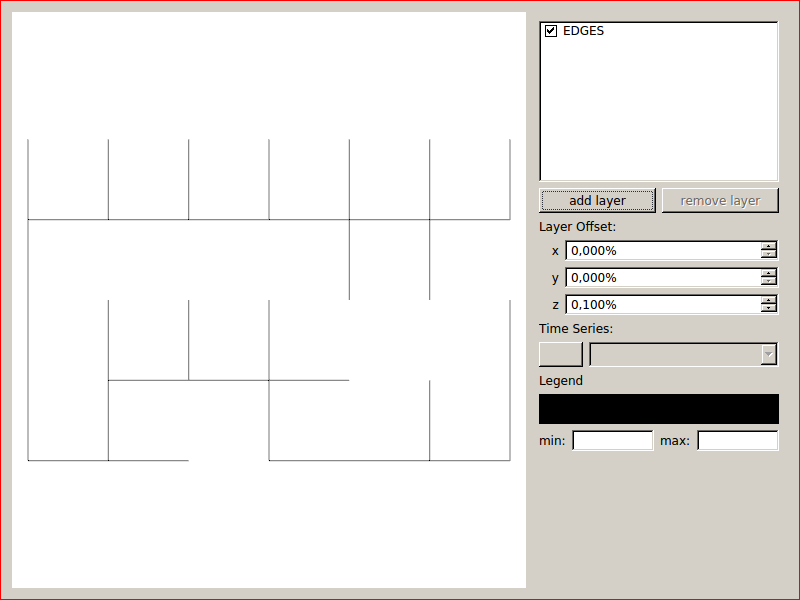
At this point we have modelled the solution via DynaMind and can run a
simulation. Before we proceed we get rid of the old simulation result
and press the Reset button (the broom) in the toolbar. Then click Run Simulation and select
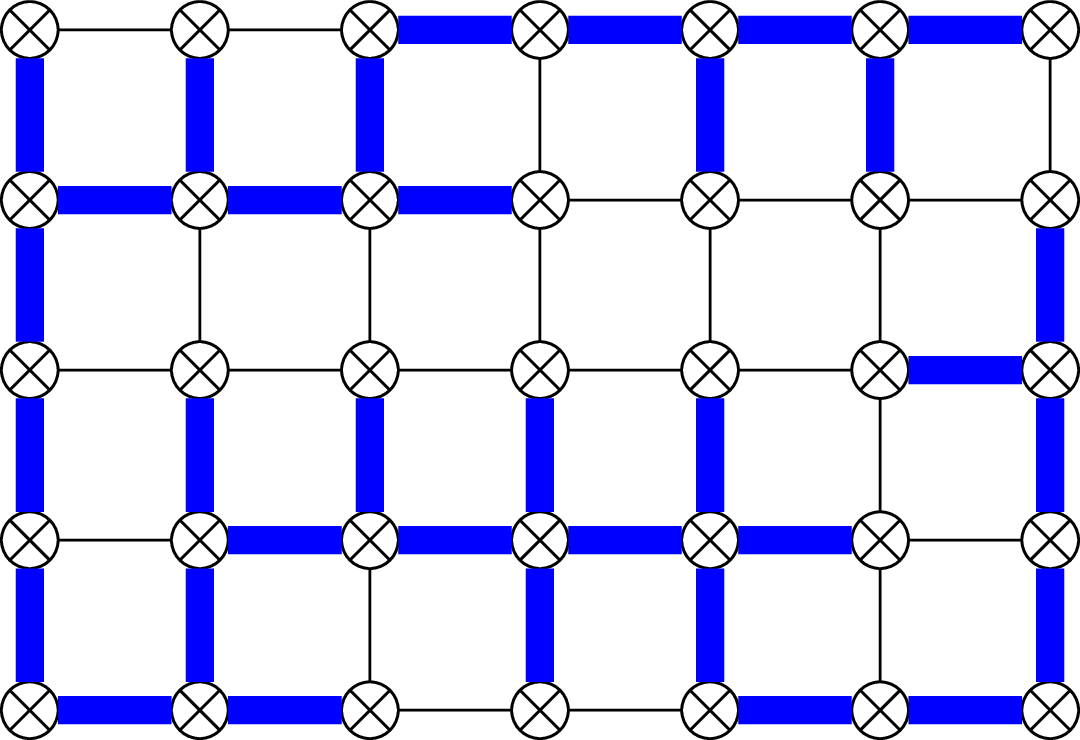
view data at out port 'Layout' to visualize the result
(add layer -> select EDGES -> OK). Note that the graph may
differ from the screenshots in this tutorial as there are multiple
minimum spanning trees for our specific grid graph.
Congratulations, you modelled and solved your first problem with DynaMind!